
Author: Doug Johnstone, Principal Consultant at Digital Pivot
Date: July 2025
Forward
As someone with over 25 years in the Professional Services and Technology sector, I’ve had the privilege of working alongside some of the most ambitious and innovative IT Services and Consulting organisations across Australia and New Zealand. From leading delivery practices to guiding go-to-market strategy, I’ve seen firsthand how market dynamics evolve and how firms must continually adapt to stay relevant, competitive, and profitable.
This report is the culmination of over 18 months of research, analysis, and direct validation with local providers, founders, and senior stakeholders throughout the region. Drawing on publicly available headcount trends and company performance data, alongside dozens of one-on-one conversations, this work reflects not only what the data tells us but also what industry insiders are experiencing on the ground.
The result is a deliberately balanced perspective – data-driven, yet grounded in the real-world challenges and decisions leaders are facing today. My goal with this report is to provide clarity and context in a rapidly changing market, and to help organisations reflect honestly on where they stand, where the market is heading, and what opportunities exist for those willing to pivot with purpose.

Executive Summary
The Australia and New Zealand (ANZ) IT services and consulting sector is experiencing a noticeable shift from broad growth to stagnation and decline in 2024–2025. An analysis of LinkedIn Sales Navigator data on 800+ service providers (firms with 50+ employees) shows fewer companies achieving headcount growth, and more companies becoming flat or shrinking, compared to a year ago. Key findings include:
- Headcount Growth Slowdown: The number of high-growth service providers (>+10% headcount growth) dropped by 9% year-on-year, while the count of flat or declining firms increased by 11%. In mid-2024, about 57% of firms were growing; by mid-2025 this fell to ~53%, as more organisations stalled or downsized. This indicates softening demand and caution in the market.
- Australia vs New Zealand: New Zealand’s consulting and IT services firms saw a sharper downturn than Australia’s. The share of NZ firms in growth mode plummeted from 57% to 43% in a year, whereas Australia’s fell from 56% to 54%. Economic pressures in New Zealand (rising interest rates, slowing public sector projects) likely hit harder, evidenced by consulting layoffs and rising unemployment.
- Mid-sized Firm Dynamics: The mid-market is in flux. The overall number of service providers grew slightly (from 828 to 843 companies), mainly through new entrants and acquisitions. Notably, the count of firms in the 501–1000 employee bracket surged ~28%, suggesting some providers grew into mid-sized status (often via M&A). In contrast, the 201–500 bracket shrank slightly, implying consolidation or stagnation in that tier.
- Consolidation via M&A: A significant portion (estimated ~25%) of the headcount growth among “growing” firms came from acquisitions rather than purely organic growth. Active merger activity – often driven by private equity – has bolstered headcounts at acquiring companies while masking cuts at the acquired entities. For example, Australia’s Atturra expanded above 900 staff in 2024–25 by acquiring multiple firms, even as many traditional firms reduced headcount. This consolidation trend indicates larger players are absorbing smaller competitors, seeking scale and new capabilities in a low-growth environment.
- Technology Disruption and New Entrants: Emerging tech, especially AI, is reshaping the landscape. New specialist providers harnessing artificial intelligence and automation have entered the market with speed and niche expertise, capturing demand that legacy consultancies have been slow to fulfill. Digital transformation and AI-related services are top growth areas – cited by 37% of consulting leaders as a priority – and firms that “pivot” to these high-demand offerings are seeing renewed growth. Meanwhile, those sticking to legacy solutions face declining relevance.
- Lagging Product-Market Fit: Many stagnant or declining service providers suffer from “boiling frog syndrome” – a slow loss of competitiveness while awaiting demand to return. Product-market fit remains a critical issue; service lines that thrived in years past (e.g. on-premises IT, traditional ERP consulting, generalist offerings) are now commodity or oversupplied. Firms not actively reinventing their value propositions around current client needs (cloud, cybersecurity, AI, industry-specific solutions, etc.) are losing ground. Leadership at top firms acknowledge the need for bold change – as KPMG NZ’s CEO noted, “The time for gradual change is over; we need a transformation to ensure we’re prepared for the future.”.
- Zero-Click Search & Marketing Shift: A digital marketing challenge is also brewing – the rise of zero-click searches on Google (now nearly 60% of searches) means fewer prospects click through to provider websites for information. Many IT consultancies underestimate this threat. Companies that adapt their SEO and content strategies for featured snippets and AI-driven search (the “first movers”) are gaining visibility, while others see dwindling web traffic. Over half of potential clients may get their answers from search results or AI without visiting a site, underscoring the need for new approaches to reach the market.
- Outlook – Adaptation Required: Despite current headwinds, opportunities abound for those willing to pivot. Clients are still investing in strategic projects (particularly around resilience, productivity and tech-enabled transformation), but they will “only pay top dollar for strategically important work”. Firms that focus on high-value consulting, leverage technology, and demonstrate clear ROI are poised to capture this demand. The optimistic profit outlook reported by 86% of ANZ professional service firms for 2024 hinges on achieving these efficiencies and innovation. In short, the market is bifurcating – agile, tech-savvy consultancies are growing, while many others face a reckoning.
The data tells an honest story of a market where complacency is punished
In conclusion, the ANZ IT services sector is at a crossroads. After years of broad growth, the tide has shifted to favour firms that proactively realign with new market realities. The data tells an honest story of a market where complacency is punished – but also where strategic pivots can revive growth even in a tough climate. The following report delves into these trends in detail, providing analysis and visual illustrations, and offers guidance on how service providers can navigate the current market dynamics to thrive.

Market Overview: A Slowing Growth Trajectory
In the wake of the post-pandemic boom, 2023–2024 brought a more muted growth environment for ANZ consulting and IT services. Industry research indicates that growth in Australia’s consulting market halved to ~5% in 2023, down from the double-digit rates seen in the rebound of 2021–2022. Multiple factors contributed to this slowdown:
- Economic Headwinds: Persistently high interest rates and inflation in 2023–24 dampened business investment and IT spending. In Australia, interest rates peaked in response to inflation, increasing the cost of capital for projects and acquisitions. New Zealand likewise saw economic tightening; unemployment in NZ rose to ~4.6% by mid-2024 (from historic lows near 3%), easing a previously hot labour market. These conditions made clients more cautious in consulting procurement, seeking cost efficiency and scrutinising ROI on external spend.
- Tighter Client Budgets: Many enterprises and government departments curtailed discretionary projects. Notably, public sector consulting demand fell – PwC NZ, for example, cut 50 jobs in 2024 due to falling demand in its government advisory business. Private sector clients shifted toward “must-have” initiatives and sweat existing assets longer. As Source Global notes, clients will still invest in consultants but “will only pay top dollar for strategically important work” aligned to transformation and resilience goals.
- Professional Services Optimism (with Caveats): Interestingly, despite these challenges, surveys in early 2024 showed optimism among ANZ professional service firms. In Deltek’s annual Clarity study, 86% of ANZ firm leaders expected profit increases in 2024. This optimism was predicated on internal improvements – better utilisation of staff, controlling costs, and leveraging technology – rather than market expansion. It suggests firms realise that margin growth in a flat market must come from productivity and efficiency gains (more billable hours, automation, reduced overhead), as opposed to relying on revenue boom. In essence, many firms hoped to “do more with less” in 2024.
- Technology as a Growth Enabler: The same Deltek study highlighted that investment in technology is seen as the top growth driver for the year. Firms across consulting, IT services, engineering and other fields were prioritising IT infrastructure upgrades and emerging tech (AI, automation tools) above even client experience or branding initiatives. The rationale: tech adoption can improve efficiency and open new service lines. Indeed, after two frenetic years of talent wars, the focus shifted from hiring to tech-driven productivity – leaders reported slightly less emphasis on talent growth as the labor market cooled, and more on leveraging tools like generative AI to amplify output.
- Market “New Normal”: The flurry of the pandemic-era digital projects subsided to a steadier pace. Some analysts call the 2023–24 environment a recalibration to a “new normal” for deal activity and consulting demand. While we did not see a severe downturn (no collapse in demand), the easy growth is gone. Firms must now actively compete and innovate for each percentage of growth.
Against this backdrop, we examine the specific headcount trends across the ANZ IT service provider landscape from mid-2024 to mid-2025. Headcount is a telling indicator for service businesses – it reflects both the confidence to invest in capacity and the reality of demand for services (since in professional services, revenue is closely tied to human capital). Below, we break down how different groups of companies have fared.
Headcount Growth Trends: Growth vs Stagnation vs Decline
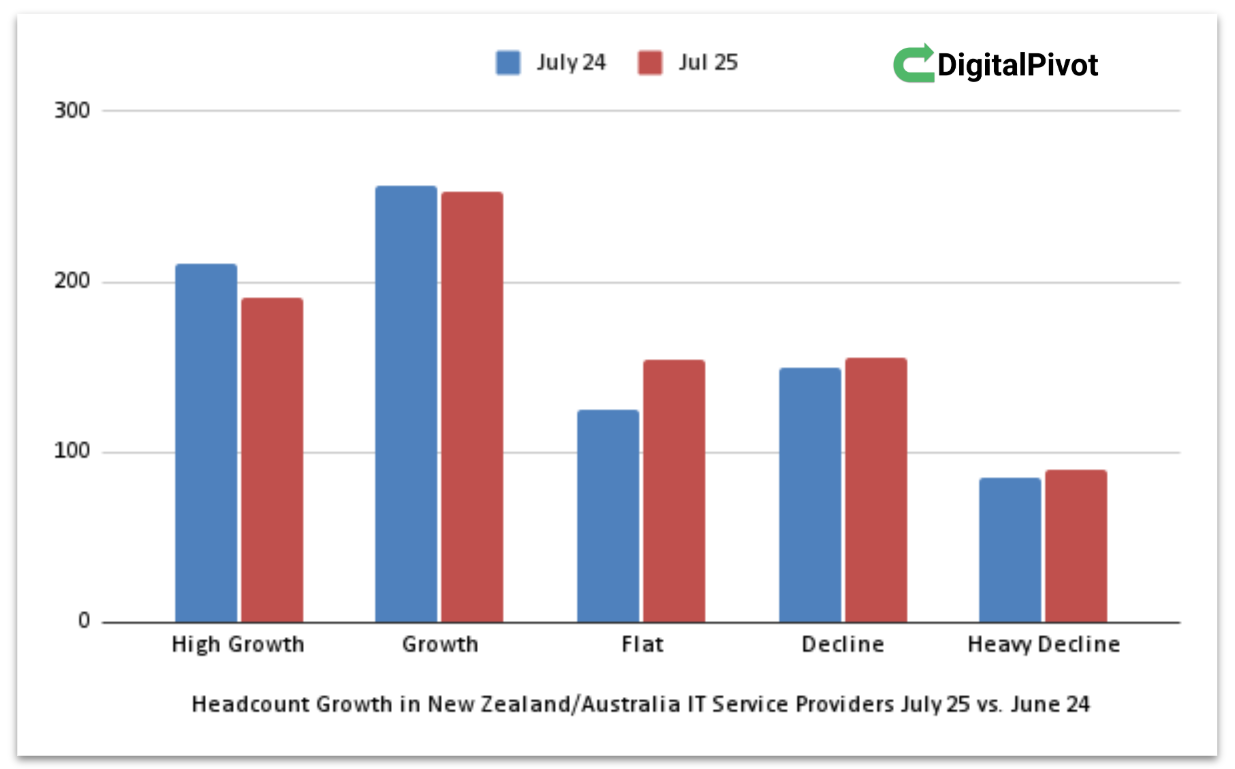
Figure 1: Number of ANZ IT service & consulting providers by headcount growth category, comparing July 2024 and July 2025. High Growth = >10% increase in headcount; Growth = 2–10%; Flat = -1% to +1%; Decline = -2% to -10%; Heavy Decline = >10% decrease in headcount. Source: Digital Pivot analysis of LinkedIn Sales Navigator data.
As illustrated in Figure 1, the distribution of growth categories shifted noticeably from 2024 to 2025:
- Fewer High-Growth Firms: In July 2024, 211 companies (out of 828) were in “High Growth” (>10% headcount growth year-on-year). By July 2025, that count fell to 191. This 9% drop in the number of high flyers suggests that some fast-growing firms hit turbulence. Some likely dropped into the moderate growth tier, while others possibly saw growth stall out after aggressive expansion (the fate of many startups/scale-ups as market conditions toughened).
- Stable Moderate Growth: The number of firms with modest growth (2–10% headcount increase) was relatively stable: 257 in 2024 down slightly to 253 in 2025. This slight 2% dip indicates that the middle band of growers held steady. Many companies managed to eke out single-digit growth – often by focusing on specific niches or upselling existing clients – but overall, few additional firms joined their ranks.
- Surge in Flat Outcomes: The “Flat” category (no significant change, -1% to +1%) swelled from 125 to 154 companies, a 23% increase. This is one of the most striking shifts. It implies a large group of firms that were growing modestly in 2024 saw their growth grind to a halt by 2025. Some may have hit capacity or paused hiring due to uncertain demand; others possibly experienced equal hires and attrition. The boiling frog syndrome is apparent here – many leadership teams sat tight as pipelines slowed, essentially treading water over the year.
- More Firms in Decline: Both decline categories grew in count. “Decline” (slow shrinkage of -2% to -10%) ticked up from 150 to 155 firms, while “Heavy Decline” (rapid shrinkage >10% down) jumped from 85 to 90 firms. Combined, there were 245 companies shrinking in 2025, versus 235 a year prior. This 4% increase in declining entities, coupled with the flat cohort growth, underscores a broad-based stagnation. Not only did fewer firms grow, but slightly more actually contracted, reflecting challenges like project cancellations, layoffs and perhaps attrition outpacing hiring.
Overall, growth became more elusive. In mid-2024, 468 out of 828 firms (56%) were growing to some degree, versus 444 of 843 (52.7%) in 2025 – a notable shift of the growth-vs-no-growth ratio. Meanwhile, the combined total of flat or declining firms rose from 360 to 399, now making up 47% of the sample (up from 43%). The balance tipped toward stagnation/decline by about 4 percentage points in one year.
It is worth noting that these figures are net counts – behind them, individual companies transitioned between categories:
- Some 2024 high-growers slowed into low growth or flat by 2025.
- A few in decline possibly stabilised to flat (or even returned to growth) – showing turnaround is possible.
- Worryingly, several formerly flat firms slipped into decline as demand failed to pick up.

Insights into the “Flatlining” Majority
The data suggests a growing “flatlining majority”: nearly half of the service providers are now in the flat-or-worse bracket. Conversations with industry leaders indicate many of these firms hoped for a market rebound that has yet to materialise. Instead of proactively reinventing offerings or pursuing new markets, they are in a holding pattern – cutting costs, maybe trimming a few staff, but largely trying to wait out the storm. This can be a dangerous strategy; as one might say, hope is not a strategy. Without decisive action (new value propositions, sales efforts, or operational changes), flat can quickly turn into decline if the market doesn’t rebound swiftly.
The psychology of “flat” firms often involves attributing stagnation to external factors (market downturn, skills shortage, etc.), expecting that “once clients start spending again, we’ll be fine.” However, as the ongoing growth of some peers demonstrates, client spending is happening – but it’s flowing to those who adapt. For example, providers emphasizing cloud, cybersecurity, or AI analytics are growing by capturing budget that traditional services aren’t. Firms stuck with pre-2020 business models (e.g. on-premises infrastructure projects, generic app development) find fewer takers today.
High Growth vs Heavy Decline – Two Extremes, Often Linked to M&A
It’s also telling that the “High Growth” and “Heavy Decline” categories both decreased as a share of the total. High-flyers fell, heavy decliners rose modestly – suggesting some dramatic growth stories fizzled out or reversed. In many cases, these extremes are tied to mergers and acquisitions:
- Acquisition-driven Growth: A chunk of the high-growth firms achieved their numbers by buying smaller companies (inorganic growth). We estimate about one-quarter of growth cases above “flat” in 2025 were due to acquisitions rather than pure market expansion. A typical scenario: a service provider with 100 staff acquires a competitor with 40 staff – its LinkedIn headcount jumps 40% overnight, appearing as “high growth”. But the combined business may not have grown revenues proportionally (and might later downsize redundant roles).
- Post-Merger Cutbacks: On the flip side, the acquired companies often register as heavy decliners. After a buyout, many employees update their LinkedIn to the new parent company; the acquired firm’s profile shows a sharp drop (sometimes > -10%) in headcount. Additionally, post-merger integration typically brings layoffs or attrition (especially with cost-cutting mandates in tough times). The data is skewed by M&A, in that one company’s big gain is another’s loss. Over 2024–25, numerous mid-sized IT providers in ANZ were absorbed into larger entities. A rough estimate is that 25% of “growth” companies’ gains correspond to shrinkage at acquired entities. The net effect for the industry might be flat headcount, but it shows up as growth in one place and decline in another.
- Examples: Beyond Atturra, global players also consolidated the market. For instance, Evergreen Services Group’s acquisition of NSW-based MSP CT Group (announced in 2024) added headcount to Evergreen’s ANZ presence. Meanwhile, KPMG’s purchase of various boutique consultancies would boost KPMG’s counts while those smaller brands disappear. Private equity is a driving force – in 2024, buyout funds in ANZ tilted investments heavily toward business services and tech firms, accounting for 70% of buyout deal volume, with consolidation a clear thesis. This high M&A activity means apparent growth can be a mirage when analysing the market at face value.
For an honest depiction, we should recognise that organic growth is even harder to come by than the raw numbers suggest. Subtract the “acquisition effect,” and the pool of truly organically growing companies is smaller – many are fighting over the same pie.
Company Size Matters: Distribution by Firm Size
Apart from growth rates, another dimension of interest is the size of the companies (by employee count). The data was segmented into size brackets: 50–200, 201–500, 501–1000, 1001–5000, and 5001+. By comparing the counts of companies in each bracket between 2024 and 2025, we can infer where growth (or consolidation) is happening.
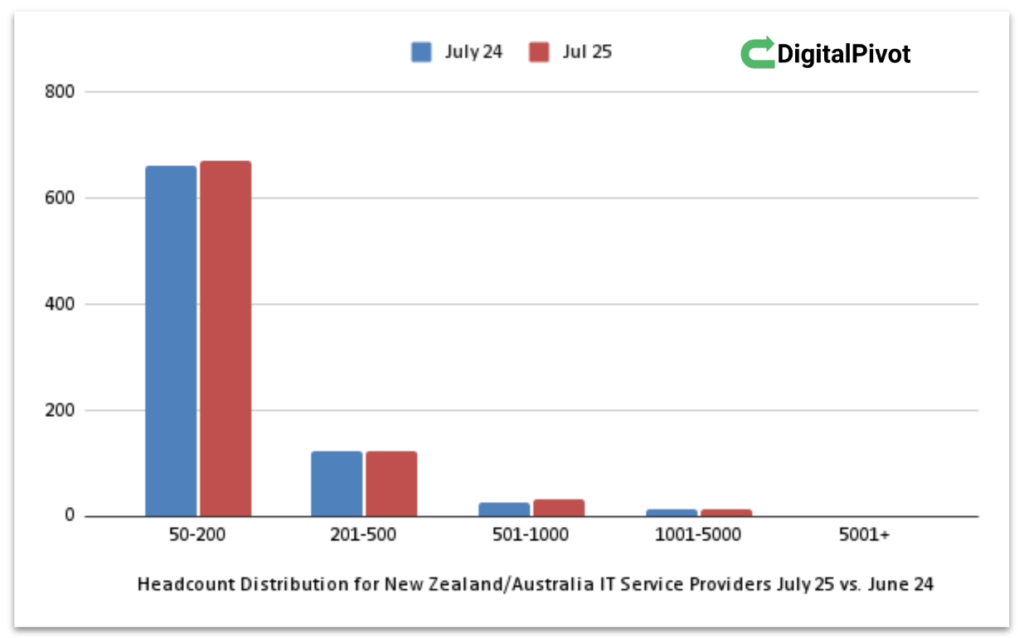
Figure 2: Distribution of IT service & consulting providers in ANZ by company size (headcount), comparing July 2024 vs July 2025. The 50–200 employee segment constitutes the majority of firms in this study. Source: Digital Pivot analysis of LinkedIn Sales Navigator data.
Several notable trends emerge from Figure 2:
- Slight Increase in Total Firms: The total number of firms in the dataset rose from 828 to 843 (+15). This suggests that despite industry headwinds, new companies are entering or growing into the market. The increase was concentrated in the smaller end – as the 50–200 bracket shows an uptick – likely reflecting startups maturing past 50 staff or new niche consultancies launching. It’s a reminder that in any disruption, entrepreneurial new entrants will arise, often exploiting gaps left by incumbents (e.g. highly specialised AI consultancies spinning up to meet new demands).
- 50–200 Segment – Still Dominant and Growing: Firms with 50–200 employees form the bulk of the industry by count (around 80% of companies). This segment grew from 662 firms in 2024 to 672 in 2025. A 2% increase may not sound huge, but adding 10 companies of this size is significant considering each likely represents a new or expanded market player. These smaller providers are often locally focused or specialised service providers. The growth here aligns with anecdotal observations: for example, several new cloud-focused consultancies and AI startups have sprung up across ANZ, hiring dozens of staff and quickly surpassing the 50-employee threshold.
- Mid-tier (201–500) – Slight Decline: The mid-tier saw a small dip from 124 to 123 firms. Essentially flat, it indicates no major influx of new midsize firms. In a thriving market, one would expect some 50–200 firms to graduate into the 201–500 range, increasing its count. The stagnant figure implies as many midsize firms contracted or got acquired as those that grew into the tier. Indeed, some 300-person companies may have dropped below 200 after layoffs, while others near 500 might have been acquired by larger entities (exiting the count). The mid-tier is often squeezed in challenging times – they are too large to be as nimble as a small boutique, but too small to have the diversification and cushion of a big firm.
- Emergence of 500–1000 Segment: By contrast, the 501–1000 employee bracket jumped from 25 to 32 firms – a 28% increase. This is a notable shift. It suggests that a handful of firms successfully scaled up into this category (or were consolidated into it). The Australian market, in particular, saw companies cross the 500 mark. This could be due to organic growth for some (e.g., winning major contracts allowing scaling of teams) and M&A for others (multiple acquisitions pushing a firm over 500). The rise of this segment indicates a strengthening tier of homegrown large providers bridging the gap between the Big Four / global giants and the small boutiques. These firms might be ones to watch, as they have critical mass but are still agile compared to multinationals.
- Large Enterprises (1001–5000) – Slight Decline: The count of companies in the 1001–5000 range went from 15 down to 14. This could be due to one firm dropping below 1000 (perhaps through divestment or spin-off) or merging upward. It’s essentially stable – very few ANZ-grown firms reach this scale without being part of a global network, so this category typically includes regional arms of global IT firms or the largest local IT service companies (like Datacom in NZ, which sits in this range).
- 5001+ (Major Players) – Unchanged: There were only 2 companies in 5001+ in both periods. These are likely the multinational tech consultancies or IT outsourcers with massive presence (for instance, IBM Australia, Accenture Australia, etc., which have thousands of staff). This remained constant – no local firm suddenly joined their ranks, and those giants maintained their scale (if anything, some multinationals have reduced staff globally but that hasn’t changed the count of companies in this bracket).
The implication of the size distribution trends is two-fold:
- Opportunity at the Bottom: The growth of the 50–200 segment shows that barriers to entry remain low for niche specialists. In fact, when larger firms struggle to innovate, clients sometimes turn to smaller consultancies or startups with cutting-edge offerings (e.g., an AI specialist consultancy founded by ex-corporates). The environment of 2024–25 is fostering such entrants, who can hire talent from downsizing bigger firms and quickly capture market share in emerging domains.
- Consolidation at the Mid/Top: The expansion of the 501–1000 tier at the expense of the 201–500 tier suggests consolidation is creating bigger entities. Medium players are either scaling up or being absorbed. The market may be polarising into very large and small, with fewer in the mid-range. This reflects a common industry cycle: during slower growth periods, mid-sized companies often find it hard to survive independently – they either find a niche to grow (moving up the ladder) or they exit via acquisition to a larger competitor looking for growth. We are seeing both outcomes in ANZ.
For leadership at service providers, this trend highlights the importance of strategic positioning. Mid-sized firms must decide: do we have the strength to become a dominant player (perhaps through our own acquisitions or specialisation), or should we seek a partnership/merger while our value is still high? Anecdotally we observed multiple long-term founders in this space are indeed open to acquisition offers which corresponded with an active M&A market.
Regional Comparison: Australia vs New Zealand
While Australia and New Zealand often move in tandem, there are some differences in the consulting and IT services landscape worth noting:
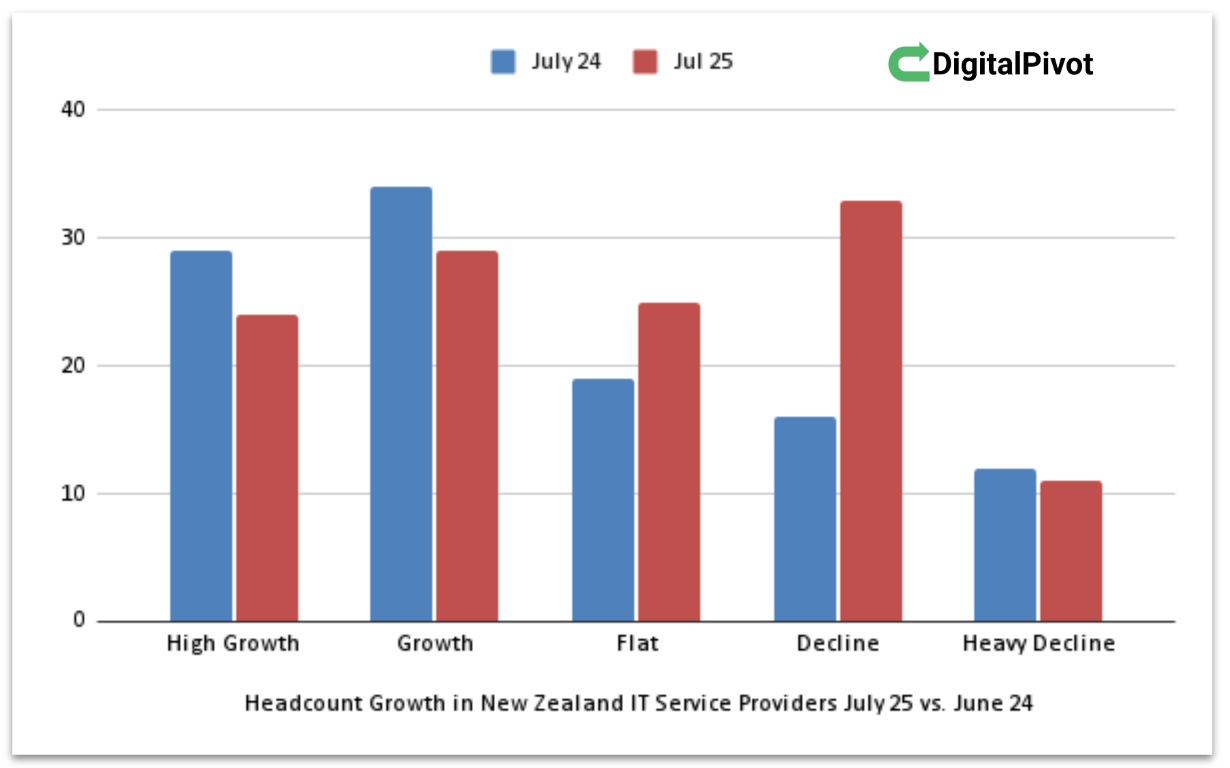
- New Zealand’s Sharper Downturn: New Zealand-only data shows a 16% drop in growth-category firms (from 63 to 53) and a 47% surge in flat/declining firms (47 to 69) from 2024 to 2025. This indicates NZ had proportionally more companies slip into stagnation or decline. Several factors could explain this:
- Smaller Market, Big Impacts: NZ’s economy and IT sector are smaller and were hit hard by public sector belt-tightening. As mentioned, both KPMG and PwC cut consulting roles in NZ in 2024 due to project cutbacks, and government IT spending slowed after pandemic stimulus faded. Such cuts have a ripple effect in the local market.
- Less Private Sector Dynamism: The private tech sector in NZ, while vibrant, doesn’t have the same volume of large-scale tech companies or venture capital as Australia. So NZ firms may have had fewer alternative growth avenues when traditional work slowed.
- Brain Drain and Talent Migration: Throughout 2023, many NZ tech workers were impacted by global tech layoffs (e.g., Xero, Pushpay downsized; global companies like Microsoft NZ cut ~30% of local staff). Some talent left for Australia or elsewhere, possibly hampering NZ firms’ ability to deliver and grow. A cooling labor market can benefit employers (easier hiring), but it also often accompanies weaker demand.
- The net effect is NZ firms became more defensive – focusing on cost control, waiting for the economy to pick up (which as of mid-2025 it has only slightly). The jump in “Decline” category in NZ (from 16 to 33 firms) is striking – more than double. It suggests quite a few smaller NZ providers either downsized or closed units. Indeed, some may have fallen below the 50-person threshold (thus exiting the dataset entirely).
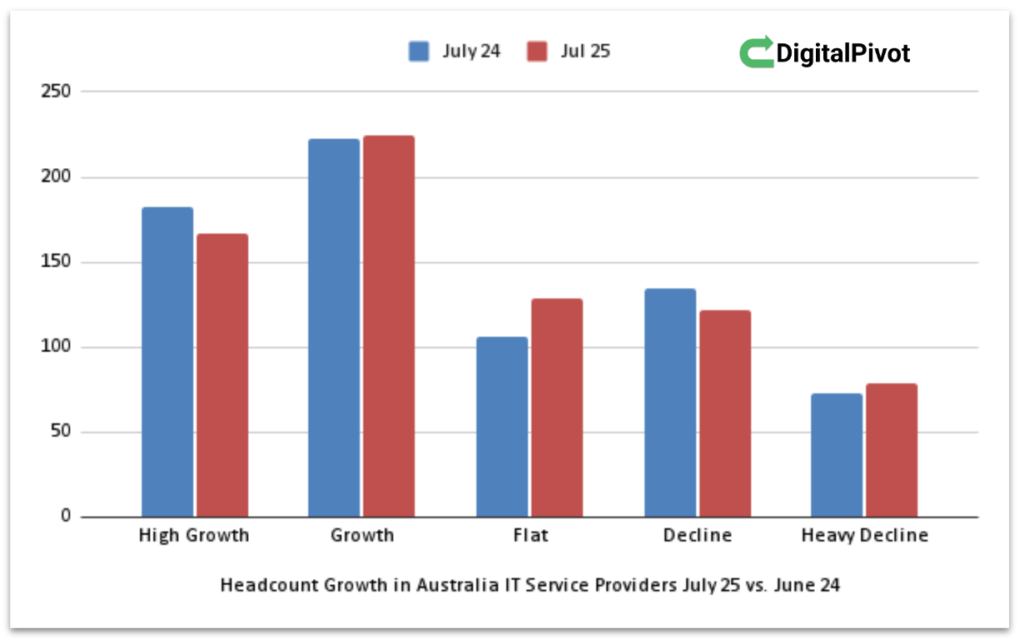
- Australia’s Resilience (Relative): Australia saw a milder shift: a 3% drop in growth firms and 5% rise in flat/decline counts. The larger and more diversified Australian economy likely cushioned the blow. Sectors like mining, finance, and a stronger post-Covid recovery provided ongoing projects for IT service providers. Additionally, Australia saw more tech M&A which kept some growth figures propped up. The presence of many APAC headquarters and higher investor activity in Australia means more lifelines for firms to find new business or funding. That said, Australia is not immune: we saw big players like KPMG Australia also announce restructuring and ~200 layoffs in 2023–24. The consulting market growth slowed to ~5%, as noted, and segments like financial services and telecom showed weaker demand in some reports. Still, Australian consultancies generally remained optimistic, with a majority expecting profit growth through efficiency.
- Cross-Border Dynamics: An interesting dynamic is the integration of the ANZ market. Several Australian firms acquired NZ companies to extend their footprint (e.g., Atturra acquiring a NZ managed services provider). Conversely, some NZ-born firms (like Datacom, which is one of the largest in the region) derive a lot of revenue from Australia now. For many NZ firms, growth involves expanding into Australia’s larger market. In 2024, cross-Tasman expansion was a strategy for those that could afford it. Those that couldn’t often became targets for acquisition by Aussie firms. This cross-pollination means the fate of NZ providers is increasingly tied to Australian parent companies or clients, which can be a double-edged sword (more opportunities, but also more exposure to global competition).
In summary, New Zealand’s IT service sector is feeling more pain than Australia’s, with a considerable swing toward decline. Australian firms fared relatively better, but the overall pattern of slowing growth is consistent. For NZ companies, the urgency to adapt is perhaps even greater – the domestic market is tough, so looking to Australia or specialising deeply could be survival strategies. Australian firms, while faring better, should not be complacent either; the slight downturn could accelerate if economic or competitive pressures rise.

Key Drivers Behind the Trends
Several underlying drivers help explain why we see these statistical trends in headcount and growth. Understanding these causes can guide service provider leaders in how to respond.
Economic and Market Forces
- Interest Rates and Financial Pressure: As noted, higher interest rates across 2023–24 made both customers and service providers more conservative. Clients deferred projects with longer ROI, and some service firms found financing growth (or cash-flowing new hires) more difficult. The M&A observation from L.E.K. Consulting highlights that high rates suppressed big deals and increased focus on cost management. In an environment where cost of money is high, service providers can’t rely on cheap capital to fund expansion or cushion losses – they must either be profitable or have strong backers. This weeds out weaker players over time, contributing to the decline in some firms.
- Market Saturation in Traditional Services: Over the past decade, a lot of capacity was built up for “bread-and-butter” IT services – things like infrastructure management, ERP implementation, standard software development, project management offices, etc. As clients completed major waves of these implementations (or moved them to cheaper offshore/automated solutions), the demand growth slowed. There are more providers chasing fewer traditional contracts, driving price competition and margins down. Those without differentiation are struggling to win new work, leading to hiring freezes or layoffs. Essentially, parts of the IT services market matured and entered a low-growth phase.
- Geopolitical and External Factors: The wariness in 2024 was also tied to global factors – war in Europe along with US and China trade tensions, etc., which affected business confidence. Additionally, supply chain issues and inflation made some companies divert attention inward (fixing operations) rather than launching new IT initiatives. ANZ businesses, being relatively small global players, often react to global trends. If multinational clients or vendors pulled back, local service providers felt the pinch. For instance, global tech giants reducing partner spending could hurt ANZ consultancies that serve as implementers or resellers.
- Public Sector Cycles: Particularly in New Zealand (and to some extent Australia), government spending runs in cycles. After heavy spending in 2020–2021 for pandemic response and digital services, the public sector pulled back in 2023 (partly to rein in deficits). Consulting firms heavily exposed to government projects (e.g., in Wellington or Canberra) saw demand dip. The PwC example in NZ – cutting staff due to reduced government advisory work – is emblematic. Until the next wave of public sector projects (like digital government or infrastructure initiatives) kicks in, those firms face an uphill battle replacing that revenue.
Consolidation and Investor Influence
- Merger & Acquisition (M&A) Activity: As detailed earlier, M&A has both propped up and hollowed out the stats. The ANZ deal market in 2024, while not at 2021 frenzy levels, showed signs of a rebound in late 2024. Private equity dry powder, combined with aging founders looking for exits, led to a robust pipeline of deals. This consolidation is a response to the low growth environment: scale can provide efficiency (shared overhead) and broaden service offerings, theoretically allowing better cross-selling. However, the flip side is a period of turmoil as merged entities integrate. Often, the first year post-merger sees limited growth – leadership is busy merging systems and cultures, clients may adopt a wait-and-see approach, and employees face uncertainty (sometimes leading star talent to leave). So while acquisitions create headlines of growth, they can temporarily contribute to stagnation or hidden declines until the new organisation finds its footing.
- Private Equity Playbook: A note on private equity (PE) involvement: PE firms have been actively investing in IT service providers in ANZ, attracted by their cash flows and consolidation potential. The typical playbook is to buy a platform company then bolt on smaller firms (as we’ve seen). PE ownership often pushes for rapid margin improvement and revenue growth to sell the business in a few years for profit. This can result in aggressive cost-cutting (hence headcount reduction in some areas) combined with acquisitive growth. Our observation being that PE-owned companies “move quickly to scale then sell for short term profit” is evidenced by multiple examples. The risk is that long-term innovation or organic growth takes a backseat to financial engineering. When the music stops (i.e., if a PE owner fails to find the next buyer), the company could be left with a patchwork of acquired units and a demotivated workforce. The data’s rise in flat/decline firms could include some such cases where the initial PE boost has plateaued.
- Global Players Retrenching or Refocusing: Some global consulting and IT firms with ANZ presence also restructured in 2024. We saw KPMG and PwC’s cuts; similarly, Accenture globally announced layoffs in 2023 which affected its ANZ teams. IBM spun off its managed services (Kyndryl) and both entities then had to streamline. These moves by giants can free up market share for others (e.g., mid-tier firms might win contracts the Big Four step away from), but they also flood the talent market with experienced consultants looking for jobs, heightening competition for roles at remaining firms. The net effect is churn – headcounts shifting between players but not all landing, contributing to those decline stats at certain firms.
- Client Consolidation: It’s not just providers consolidating; some client industries are consolidating too (e.g., bank mergers, telecom mergers). A consolidated client often rationalises its vendor list – meaning fewer IT service providers get the business. This “fewer, bigger clients” trend can hurt small providers reliant on one or two big clients if those get acquired or cut vendor budgets.
Technological Change and Service Offerings
- Rise of AI and Automation: Perhaps the most consequential driver is technological. The past year has seen explosive interest in AI, particularly generative AI (GPT, Perplexity, Gemini, Co-pilot, Grok etc). For IT service firms, this is both an opportunity and a threat. Opportunity because clients are seeking guidance on AI adoption, AI strategy, and integration – new consulting revenue streams. Threat because AI tools can potentially automate some of the work firms do (coding assistants reducing need for junior developers, AI doing basic data analysis instead of a consultant, etc.). Our data and observations indicate that firms leveraging AI internally and in offerings are pulling ahead. New entrants that are “AI-native” (built entirely around AI solutions) have moved quickly to capture projects, sometimes at the expense of incumbents. One consulting leader noted that AI can take over the “grunt work” and free consultants for higher value tasks – firms that embrace this can increase productivity, whereas those that don’t may simply find themselves charging too much for tasks an AI could do.
- Changing Demand Mix: Clients in 2024–25 demand expertise in cloud architecture, cybersecurity, data analytics, and AI far more than legacy tech. The IDC predicts that “spending on digital technologies is growing while traditional, non-digital spending is stagnating or even declining.” In ANZ, CEOs want digital solutions that directly tie to business outcomes. This means if a service provider hasn’t shifted its portfolio (for instance, still offering primarily on-prem IT management or old software support), its addressable market shrinks. Product-market fit is a real challenge: some firms have not developed new services to meet what clients now need. The “significant problem not being addressed actively,” we observe, refers to firms not investing in innovation or new product development. Often, they stick with what used to sell, now offering heavy discounts to win scarce deals – an unsustainable path. Without finding new fit (either new services or new customer segments), these firms inevitably decline.
- Zero-Click and Digital Marketing Shifts: On the marketing side, the way B2B clients find and evaluate service providers is evolving. The Zero-Click Search phenomenon is a prime example. Studies show nearly 60% of Google searches end without a click to a website, as users get their answer from Google’s snippet or knowledge panel. In the B2B context, prospective clients increasingly gather information from search snippets, online reviews, LinkedIn posts, and AI-driven summaries (like Bing Chat or Google’s SGE) without immediately contacting vendors. Traditional content marketing yields diminishing returns if your content isn’t the one featured or if it’s consumed via an AI agent. Many IT service firms haven’t caught up to this trend – they still bank on whitepapers and SEO blogs to generate leads, not realising much of their effort might never result in a site visit. Those who adjust by structuring content for featured snippets, using Q&A formats, and leveraging platforms (like publishing expert commentary on popular sites) can capture attention even in a zero-click world. First movers in this shift are seeing gains – for instance, a firm that was early to publish authoritative AI FAQs might now be the de facto snippet answer for AI-related searches, building its brand as a thought leader. Meanwhile, competitors wonder why web traffic is down despite good content. This dynamic pushes firms to explore new marketing approaches (webinars, community engagement, interactive tools) beyond just SEO. The bottom line is: as marketing generates fewer easy inbound leads, some service providers experience stagnating sales pipelines, contributing to flat growth.
- Customer Expectations and Delivery Models: Another change is how clients prefer services delivered. There’s a growing desire for “managed services” and outcome-based contracts rather than time-and-materials consulting. If a provider can package its service as a scalable platform or managed solution (possibly leveraging automation), it can decouple growth from strict headcount growth. However, our data set is inherently tied to headcount; a company that successfully automates may show flat headcount yet higher revenue. This could partly explain some “flat” headcount cases that aren’t necessarily failing – they might be maintaining staff count but generating more value per employee through tech. Conversely, firms that remain labour-intensive face pressure on margins. Many clients also now prefer shorter engagements or trials before big commitments, making it harder for firms to predictably grow headcount; they instead keep bench thin and hire on demand (which may reflect as near-zero growth in LinkedIn counts until a big project lands).

Adapting and Pivoting: From Decline to Growth
Amid these challenges, it’s important to highlight that decline is not irreversible. Our experience is based on recent real example: an organisation that was in decline managed to pivot its offerings and achieve 12% growth year-on-year, effectively reversing its downward trajectory:
- Refocusing on a Growth Niche: Often the first step is identifying areas of latent demand that align with the firm’s capabilities. In a success story, a stagnant IT services firm might discover, for example, that there’s huge unmet demand for cloud cost optimisation or for AI ethics consulting, etc., and then reposition around that. By achieving a new product-market fit, they unlock growth. It requires honestly assessing which services are commoditised (and can be pruned) and which emerging problems the firm is well-suited to solve. Many companies in decline have a broad, unfocused service menu; a pivot might mean specialising deeply in one high-need area.
- Innovation and Upskilling: A true pivot usually involves investing in new skills or intellectual property. For instance, training staff on a new technology, hiring a subject matter expert, or developing a proprietary methodology. This investment can be scary for a firm in decline (cash is tight), but without it, they have little new to offer. The firms that turned around likely bet on innovation – say, building an AI-based tool that compliments their consulting – thus differentiating themselves. Leaders should create a culture that rewards initiative and allows experimentation with new service ideas, even if short-term utilisation suffers.
- Go-to-Market Shift: A strategic pivot also means marketing and selling differently. If the firm historically relied on a few big clients, it might pivot to target a new sector or mid-market clients with packaged solutions. It could mean forging partnerships – for example, becoming a specialist implementation partner for a major software vendor in an emerging field. Successful turnarounds often leverage ecosystems: joining vendor programs, cloud marketplaces, or industry networks to get in front of new clients. This can rapidly open a spigot of demand without the firm having to build brand from scratch. In the case mentioned, perhaps the firm leveraged the “Zero Click” mindset – putting out genuinely useful, targeted content (like tools, templates, webinars) that drew interest in its new offering. The narrative today is that thought leadership and educational marketing can set pivoting firms apart, as clients are hungry for guidance in new areas (and are more likely to engage with those who demonstrate expertise generously).
- Leadership and Mindset: Lastly, pivoting requires a change in mindset from the top. Founders or executives who were emotionally attached to a legacy offering must be willing to cannibalise their own business before someone else does. The mention that many long-term founders are seeking exits suggests some have lost the appetite to reinvent yet again. But those who did muster the will to pivot are seeing results. As the KPMG NZ CEO’s quote indicated, incremental tweaks aren’t enough; bold transformation is needed. In practice, that might mean restructuring teams, shedding low-margin lines, and rallying the company around a new value proposition. It’s tough, but the payoff can be a return to sustainable growth, as evidenced by the example of 12% YoY growth after a pivot – outperforming the market average significantly.
It’s worth reinforcing that customer-centric innovation drives successful pivots. The issues of “product-market fit” are solved by deeply understanding the evolving needs of clients and re-aligning the business to meet those needs. In 2025, those needs revolve around faster results, more automation, strategic guidance in a digital world, and measurable outcomes. Firms that reorganize themselves to deliver on those needs (whether via new tech, new services, or new business models like outcome-based pricing) are the ones that will populate the High Growth category next year.

Conclusion: Navigating the Road Ahead
The data and analysis above paint a picture of an industry in transition. The ANZ IT services and consulting sector has moved out of a high-growth phase and into a period where adaptability is the name of the game. Many firms are feeling the squeeze of flattening demand, but a significant number are also finding ways to grow – revealing a gap between those who evolve and those who wait.
For IT service and consulting leaders, the path forward in this market is clear: take proactive steps to pivot and innovate, or risk being left behind. This could mean embracing new technologies (AI, automation, cloud-native solutions), exploring new markets or verticals, realigning sales strategies to how clients now discover services, or even considering strategic partnerships/mergers for scale. The “boiling frog” firms that do nothing may not perceive the incremental temperature rise of competition and changing client expectations until it’s too late.
On the other hand, the success stories and growth pockets show that opportunity is still abundant. Demand has not disappeared – it has shifted. Clients still need expert partners to help navigate complexity and change. In fact, one could argue clients need better partners now than before, since they are aiming for efficiency and smart investment of every dollar. Providers that can clearly connect their work to client value (revenue growth, cost savings, risk reduction) will continue to win engagements. The optimistic profit outlook many firms have for 2024 suggests they believe they can do this. Achieving it requires internal transformation as much as external.
Finally, it’s important to bring this narrative back to the core idea of “Digital Pivot.” Just as the industry is at a pivot point, so too must individual companies pivot strategically. Whether it’s pivoting your service line, your target market, or your delivery model, the willingness to make a bold change can define your trajectory. At Digital Pivot, this philosophy is at the heart of what we advocate: helping IT services and professional services organizations reimagine and realign their businesses for sustainable growth. The trends discussed – from AI disruption to zero-click marketing to consolidation – are not threats to be feared, but signals to act upon. Those who read the signals and adapt will find that it’s possible to not only survive a tough market but thrive in it. The data shows the consequences of inaction, but it also hints at the reward for action – in an example, turning a declining business into a double-digit growth leader within a year.
In conclusion, the ANZ IT services market’s dynamics in 2025 demand honesty, agility and strategic vision from its players. By honestly confronting the data (as we have in this report), embracing agility (through pivots and innovation), and setting a clear strategic vision (focused on emerging client needs), service providers can navigate the current headwinds and chart a course to renewed growth. The road ahead may be challenging, but with the right adjustments, it leads to a more resilient and future-ready industry.
Methodology and Data Assumptions
Data Source: This report’s analysis is based on data gathered via LinkedIn Sales Navigator for Australia and New Zealand companies in the category “IT Services and Consulting.” Two data snapshots were taken (July 2024 and July 2025) capturing company headcounts as listed on LinkedIn. We filtered to include only companies with 50 or more employees in both periods (excluding very small firms under 50). The companies were further segmented into size brackets (50–200, 201–500, 501–1000, 1001–5000, 5001+) and into growth rate categories based on the year-over-year percentage change in headcount from July 2024 to July 2025.
Growth Categories Defined: We defined five growth categories:
- High Growth: > +10% headcount growth over the 12-month period.
- Growth: +2% to +10% growth.
- Flat: -1% to +1% change (essentially stable headcount).
- Decline: -2% to -10% decrease in headcount.
- Heavy Decline: < -10% headcount decrease.
These categories are somewhat coarse but provide a clear way to classify performance. The choice of ±1% for “Flat” was to capture those essentially unchanged, acknowledging minor fluctuations as negligible. Growth or decline beyond ±2% was considered meaningful change.
Methodology: Using Sales Navigator’s filtering, we identified all companies in the IT Services & Consulting industry in ANZ in the specified size ranges. We recorded their headcount (as reported on LinkedIn company pages) in July 2024 and again in July 2025. The data was then aggregated into the categories and tables shown. We also performed a manual review of about 25 companies that had extreme changes or that we knew were involved in M&A, to understand qualitative reasons behind the numbers (for example, confirming if a headcount jump was due to an acquisition announcement, etc.). This helped inform assumptions about how much acquisition played a role.
Key Assumptions and Limitations:
- LinkedIn Data Reliability: We assume LinkedIn headcount is a reasonable proxy for actual staff count. Most professional employees have LinkedIn profiles, but not all update immediately. There’s an estimated error margin: some companies’ LinkedIn counts lag real staffing by a few months, and a minority of employees (~<3%) might not be on LinkedIn or keep their profile current. However, since we compare the same source year over year, the relative changes should be indicative. The error is likely consistent over time (e.g., a company that under-reports by 5% likely did so both years).
- Acquisition Effects: We assumed that roughly 25% of cases of growth >2% were influenced by M&A rather than pure organic hiring. This was based on anecdotal evidence from examining specific firms known to have acquired others. We also noted some “decline” cases were the mirror image of that (acquired companies’ counts dropping). While 25% is an estimate, it highlights that the true organic growth in the sector is a bit lower than the raw data shows. We did not have exact figures on how many hires were due to M&A, so this is a qualitative overlay on the quantitative data.
- Consolidation of Brands: Post-acquisition, sometimes employees remain listed under the old company’s LinkedIn page for a while (if they don’t switch their profile). This can temporarily inflate the apparent headcount of an acquired firm or understate the acquirer’s count. Over a year, most transitions should reflect (especially if the old brand is retired). We assumed any such discrepancies even out across the hundreds of companies in the sample.
- Industry Categorisation: “IT Services & Consulting” as defined by LinkedIn includes a broad range of companies – from management consulting arms of firms, to software development shops, to managed IT service providers. We did not separate these subcategories in the data. It’s possible that, for example, pure management consulting firms have different trends than pure IT outsourcing firms. Our analysis treats them together as one “professional services” ecosystem. Where relevant, we injected insight (from external sources) about specific sub-trends (like public sector consulting vs tech services).
- Time Frame: The analysis is based on a one-year change (mid-2024 to mid-2025). This captures recent trends but could miss longer-term cycles. For instance, a company might have ramped up in 2022 and then plateaued – our snapshot would show it as flat in 2024–25, but that doesn’t show the prior growth. We focused on the recent delta to address current dynamics, assuming that is most relevant to immediate strategy.
For more information, contact us
FAQs – How do I pivot our offerings into growth markets?